

Remote Therapeutic
Drug Monitoring
Real-time clinical response data, wherever the patient is.
Dosage Monitoring integrates three objective data streams, validated digital clinical questionnaires, remote therapeutic drug monitoring (TDM) via microsampling, and connected physiological devices, into a unified, real-time clinical dashboard. Clinical decisions backed by data, not guesswork.
Three Real-Time Data Streams
- Digital Clinical Questionnaires — Validated PROs — patient, caregiver, and clinician inputs
- Remote Therapeutic Drug Monitoring — At-home microsampling · ISO 15189 accredited lab
- Connected Physiological Devices — Smart scales · BP monitors · Heart rate trackers
The Monitoring Gap
Clinical Decisions
Made
Without Real Data
The clinical response to medication happens between appointments, yet most clinicians rely entirely on subjective patient recall during brief, scheduled visits to make treatment decisions.
01
No Objective Data Between Visits
Treatment response, side effects, and clinical deterioration all occur between appointments, but without continuous monitoring, clinicians see only a single, unrepresentative data point at each visit.
02
TDM Requires a Clinic Visit, So It Rarely Happens
Therapeutic drug monitoring requires venous blood draw at a clinic, a barrier that means most patients on narrow-therapeutic-window medications are never objectively monitored between prescriptions.
03
Questionnaires Are Paper-Based and Fragmented
Clinical PRO instruments are administered inconsistently, scored manually, and stored outside the clinical record, preventing longitudinal analysis and comparison against treatment changes.
04
Physiological Data Stays on the Device
Patients using connected health devices (scales, BP monitors) generate valuable data, but it lives in disconnected consumer apps, never reaching the clinician’s dashboard or the clinical record.
How Dosage Optimisation Works
One Unified Dashboard.
Three Objective Data Sources.
Dosage Monitoring integrates three independent, objective data streams into a single clinical view, replacing fragmented, subjective recall with continuous, structured clinical evidence.
Stream 01 · Digital PROs
Validated
Clinical Assessment
Validated, condition-specific digital questionnaires are administered directly on the patient’s device, integrating patient responses alongside caregiver, teacher, or coach inputs for a multi-perspective clinical picture.
- Validated PRO instruments configured by therapeutic area (ADHD, pain, mental health)
- Multi-contributor inputs: patient, caregiver, teacher, clinician
- Time-series visualization of questionnaire results against dosing events
- Automated triggering of additional assessments based on score thresholds
Patients collect blood capillary samples at home using a simple fingerprick microsampling device, samples are mailed via prepaid Canada Post expedited service and analyzed at a certified laboratory. Results are automatically integrated into AppMed™.
- Minimally invasive home fingerprick collection — no clinic visit required
- Analysis at an ISO 15189 and LSPQ accredited centralized laboratory
- Results legally recognized for diagnostic and clinical decision-making purposes
- Results automatically populated into the AppMed™ clinical dashboard
Stream 02 · Remote TDM
At-Home
Drug Level Monitoring
Stream 03 · Connected Devices
Real-Time
Physiological Monitoring
Connected wearable and sensor-based devices, including smart scales, pulse oximeters, and blood pressure monitors, transmit physiological data continuously to AppMed™, where it is integrated into the unified clinical dashboard alongside PROs and TDM results.
- Smart scales, blood pressure monitors, heart rate trackers
- Continuous physiological data transmission to AppMed™ dashboard
- Unified graphical view of device data, questionnaires, and TDM results
Remote TDM — How It Works
Lab-Grade Biomarker
Data, From Home
Remote therapeutic drug monitoring removes the single biggest barrier to objective pharmacological oversight, the requirement for a clinic visit. AppMed™’s microsampling workflow delivers lab-grade results directly into the clinical record.
Kit Dispatched to Patient
A microsampling kit containing a fingerprick device and collection card is mailed to the patient’s home.
Patient Self-Collects at Home
The patient performs a minimally invasive fingerprick and collects a small capillary blood sample, no special training required.
Sample Mailed to Laboratory
The sample card is mailed via prepaid Canada Post expedited service to the centralized analytical laboratory.
Analysis at Accredited Lab
The laboratory, holding ISO 15189 and LSPQ accreditation, analyzes the sample with clinical diagnostic accuracy.
Patient Self-Collects at Home
Biomarker results are automatically imported into the AppMed™ dashboard, overlaid on the PK model curve from Dosage Optimisation for direct comparison.
Laboratory Accreditation
ISO 15189
International standard for medical laboratory quality and competence. Ensures diagnostic-grade accuracy and reliability.
LSPQ Accredited
Laboratoire de santé publique du Québec accreditation, enabling legally recognized diagnostic results in medical contexts.
Diagnostic-Grade Results
Results meet the highest standards for clinical decision-making, legally recognized for use by healthcare professionals.
Canada Post Expedited
Prepaid expedited shipping ensures fast, reliable sample transit from patient home to accredited laboratory.
Integration with Dosage Optimisation
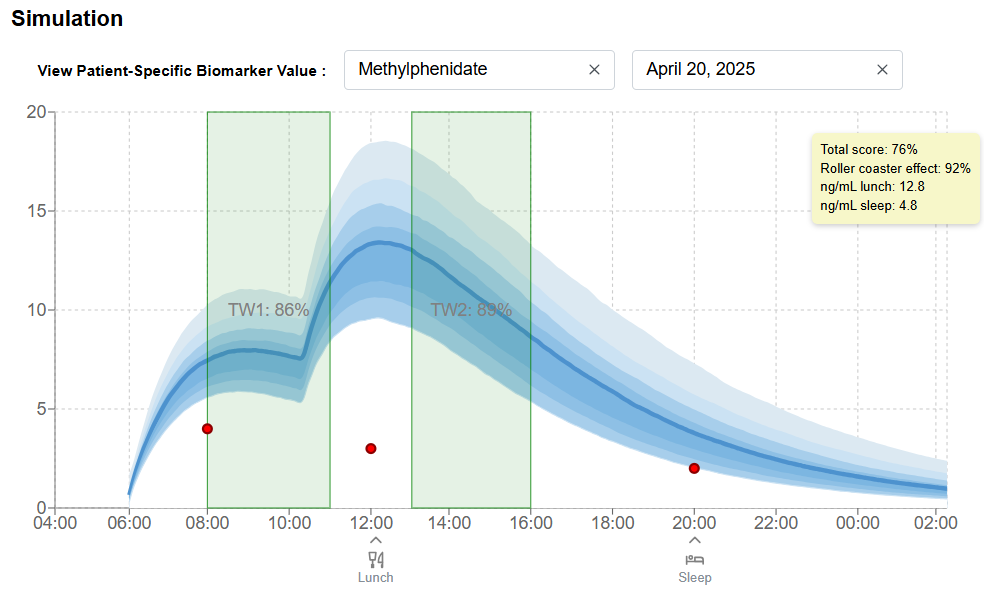
Predicted vs. Actual — In One View
Divergence between predicted and actual concentrations reveals critical clinical information: the patient may be a high or low metabolizer, or may not be responding as expected to the prescribed agent.
- Blue PK curve = model-predicted plasma concentration over time
- Red circles = actual measured TDM results from at-home microsampling
- Divergence flags metabolic outliers and non-responders automatically
Part of a Connected Platform
Three Solutions, One Ecosystem
Dosage Optimisation works in concert with Dosage Monitoring and Dosage Adherence, creating a closed loop between modelled predictions and real-world clinical outcomes.
Solution - 01
Dosage Optimization
Model-informed Precision Dosing
Individualize dosing using validated pharmacokinetic and pharmacodynamic models, enabling safer titration for medications with narrow therapeutic windows.
Solution - 02
Dosage Monitoring
Remote Therapeutic Drug Monitoring and Clinical Assessment
Track treatment response continuously with patient-reported outcomes, therapeutic drug monitoring, microsampling biomarkers, and connected physiological devices.
Solution - 03
Dosage Adherence
Medication Dispensing System
Monitor adherence via connected MDS devices, enable remote dose adjustments, and intervene early before unplanned visits become necessary.
Get Started
See Dosage Optimisation
In Your Practice
Request a clinical demonstration of the PK modelling tool, tailored to your patient population and therapeutic area. See prescription simulation live, before a single dose is prescribed.
ADHD specialists · Pharmacologists · Clinical pharmacists · 24h response